Research projects
| CONTRACT PN II IDEI nr. 194/2007, Cod CNCSIS 972 THE CONTROLLABLE PRODUCTION OF DISCONTINUITIES AND THE TREATMENT OF THE THOROUGHLY DISADVANTAGED AREAS Manager Project: Prof. univ. dr. Ioan Ianos Last update
24.Apr.2010
|
One of the most important issue, in the context of sustainable development, is an etic development of all human communities, the guarantee of good conditions for all citizens of a state or union of states. European union has revitalised the concepts and practices regarding the regional development. at the same time, the states and academic community not foggot the existing of big decays at the intra-regional level.
The present study releves the way by which the most disadvantaged areas could be sustainably developed using as main tool controlled production of discontinuities.
The production of spatial discontinuities, in the most disadvantaged areas could accelerate the improvement of life quality and reducing of discrepancies in comparison with other areas. practicaly, by production of discontinuities there is a transfer of centre-periphery decay from the regional to intra-regional or interlocal level. In the treatement of the most disadvantaged areas, by using the production of discontinuities it`s possible to identify four main steps:
a) depiction of the ressources area and the identification of the inetrvention tools;
b) identification and analysis of the barriers for intraregional and interlocal development; c) choosing of the strategy for diminishing of the discrepancies between the most disadvantaged and developped areas;
d) implementing of a strategy and intraregional politics for accelerating of development by discontinuities production. for adopting of a specific treatement very important are the concrete features of each most disadvantaged area.
In a similar context, for an effective treatement there is three concepts: centre-periphery rapport, the local/interlocal settlement system and the production of discontinuities.
Staff members’ degree of involvement
|
Member of the team
Activities
|
Ianos Ioan
|
Young researchers
|
|||
|
Peptenatu Daniel
|
Zamfir Daniela
|
Pintilii Radu
|
Vanau Gabriel
|
||
|
First activity
from first objective (2007)
|
yes
|
|
|
|
yes
|
|
Second activity
from first objective (2007)
|
yes
|
yes
|
yes
|
|
|
|
Third activity
from first objective (2007)
|
yes
|
|
|
yes
|
|
|
First activity
from second objective (2007)
|
yes
|
yes
|
|
yes
|
yes
|
|
Second activity
from second objective (2007)
|
yes
|
|
|
yes
|
|
|
Third activity
from second objective (2007)
|
yes
|
|
yes
|
yes
|
yes
|
|
First activity
from first objective (2008)
|
yes
|
yes
|
yes
|
yes
|
|
|
Second activity
from first objective (2008)
|
yes
|
|
|
|
|
|
Third activity
from first objective (2008)
|
yes
|
|
yes
|
yes
|
|
|
First activity
from second objective (2008)
|
yes
|
yes
|
yes
|
yes
|
|
|
Second activity
from second objective (2008)
|
yes
|
|
yes
|
yes
|
|
|
Third activity
from second objective (2008)
|
yes
|
yes
|
yes
|
yes
|
|
|
First activity
from third objective (2008)
|
yes
|
|
|
|
|
|
Second activity
from third objective (2008)
|
yes
|
yes
|
yes
|
|
|
|
Third activity
from third objective (2008)
|
yes
|
|
|
|
|
|
Activitatea 4
from third objective (2008)
|
yes
|
yes
|
yes
|
|
|
|
First activity
from first objective (2009)
|
yes
|
yes
|
yes
|
yes
|
|
|
Second activity
from first objective (2009)
|
yes
|
|
|
|
|
|
Third activity
from first objective (2009)
|
yes
|
|
yes
|
yes
|
|
|
First activity
from second objective (2009)
|
yes
|
yes
|
yes
|
yes
|
|
|
Second activity
from second objective (2009)
|
yes
|
|
yes
|
yes
|
|
|
Third activity
from second objective (2009)
|
yes
|
yes
|
yes
|
yes
|
|
|
First activity
from third objective (2009)
|
yes
|
|
yes
|
yes
|
|
|
Second activity
from third objective(2009)
|
yes
|
yes
|
yes
|
yes
|
|
|
Third activity
from third objective (2009)
|
yes
|
|
yes
|
yes
|
|
|
Fourth activity
from third objective(2009)
|
yes
|
yes
|
yes
|
yes
|
|
|
First activity
from first objective(2010)
|
yes
|
|
|
|
|
|
Second activity
from first objective (2010)
|
yes
|
yes
|
yes
|
|
|
|
Third activity
from first objective (2010)
|
yes
|
yes
|
yes
|
yes
|
|
|
First activity
from second objective (2010)
|
yes
|
|
yes
|
yes
|
|
|
Second activity
from second objective (2010)
|
yes
|
|
|
yes
|
|
|
Third activity
from second objective (2010)
|
yes
|
yes
|
yes
|
|
|
|
First activity
from third objective (2010)
|
yes
|
yes
|
yes
|
yes
|
|
|
Second activity
from third objective (2010)
|
yes
|
|
yes
|
yes
|
|
|
Third activity
from third objective (2010)
|
yes
|
yes
|
yes
|
|
|
Objectives and activities and the degree of fulfillment
|
An
|
Objectives
(Objective’s name)
|
Associated activities
|
Degree of fulfillment
|
|
|
2007
|
1
|
Defining basic concepts and the theoretical relations between them
|
Individual documentation on the concept of deeply disadvantaged area and of discontinuity.
|
Total
|
|
Debates at the team level regarding the rethinking of the two basic concepts, including the theoretical possibilities of treating deeply disadvantaged areas.
|
||||
|
|
||||
|
Preparing for publication, in an international magazine of an article through which it is subjected to debate the therm of deeply disadvantaged area and the necessity of its differential treatment.
|
||||
|
2
|
Establishing some criteria and the indicators system in order to delineate the profoundly disadvantaged areas at a national level
|
Analyses of experiences in outlining the interregional differences through studying the bibliography of the field.
|
Total
|
|
|
Contriving proposals for the criterias and the indicators system, which can measure as precisely as possible the differences in the development level at a microscale.
|
||||
|
Debates on the completion and validation of the indicators system.
|
||||
|
2008
|
1
|
Gathering the data base with regards to relevant indicators for measuring the levels of development at the ground territorial level
|
Prospecting central institutions capable of providing some significant indicators for the sketching of deeply disadvantaged areas.
|
Total
|
|
Debates on how to substitute some of the indicators with others with similar attributes to reflect reality.
|
||||
|
|
||||
|
Collection and storage of statistical data and geographic information necessary for defining deeply disadvantaged areas.
|
|
|||
|
2
|
The spatial delineation of the deeply disadvantaged areas.
|
Determining the deeply disadvantaged areas having as a benchmark the entire national space.
|
Total
|
|
|
Determining the deeply disadvantaged areas having as a benchmark the development regions.
|
||||
|
Comparative analysis of advantages and disadvantages of each of the determinations and the option for either of them.
|
||||
|
2009
|
1
|
Alaysis of deeply disadvantaged areas and of the circumstances of regional insertion.
|
Selecting deeply disadvantaged areas covering most relevant diversity.
Field analysis for the approval or disapproval of the selection.
|
Total
|
|
Applying the SWOT analysis to distinguishing the domestic and external environmental quality of the selected entities.
|
||||
|
|
||||
|
Prioritizing the strengths and weaknesses in the deeply disadvantaged areas selected.
|
||||
|
Preparing two articles to be published in ISI-rated magazines and 4 articles for Romanian magazines in this discipline.
|
||||
|
2
|
Outlining the discontinuities at the level of each deeply disadvantaged area.
|
Establishing the indicators that lead to sketching the disparities within each area
|
Total
|
|
|
Demarcation of characteristic areas through refining the analysis at the level of each deeply disadvantaged area.
|
||||
|
Characterization of spatial discontinuities within each deeply disadvantaged area.
|
||||
|
3
|
Acquaintance and windup of the contrivances capable of producing discontinuities.
|
Distinguishing the discontinuity inherent factors.
|
Total
|
|
|
Scaling the latter in relation with the impact that they have on local and inter-local development.
|
||||
|
Identifying the interactions chains when stimulating one of the factors and estimating the effects on development.
|
||||
|
4
|
Detection of key factors, which generate discontinuities at the level of each selected deeply disadvantaged areas
|
Analysis of internal context and external environment alongside each of the deeply disadvantaged areas.
|
Total
|
|
|
Highlighting specific types of resources that support the most dynamic factors of local and inter-local change.
|
||||
|
|
||||
|
Characterization of the main factors in terms of their ability to generate discontinuities that have an impact on development.
|
|
|||
|
2010
|
1
|
Treatment of deeply disadvantaged areas characterized by a strong homogeneity of the development level
|
Impact assessment of development stages, compared with marginal discontinuities translation inwards.
|
In Progress
(ongoing phase)
|
|
Impact assessment at the level of the area by producing discontinuities
|
||||
|
Estimating effects in the selected areas,on the functionality of local systems of settlements
|
||||
|
2
|
Treatment of deeply disadvantaged areas characterized by a mono-, bi- or multi- polar structure
|
Simulating development processes by emphasizing the center-periphery gap;
Distinguishing the ways of intervention and diffusion of development.
|
In Progress
(ongoing phase)
|
|
|
Dividing the deeply disadvantaged areas in territories subordinated to the local development centres and simulating the effects of directed interventions at their level
|
||||
|
Sending for publication in ISI-rated magazines of at least three articles.
|
||||
|
3
|
Developing a general algorithm for treatment of deeply disadvantaged areas through the controlled production of discontinuities
Preparing for publication of a volume incorporating significant results obtained during the preparation of the project
|
Synthesizing the research methodology and developing an algorithm for treatment of deeply disadvantaged areas on the main types.
|
In Progress
(ongoing phase)
|
|
|
Processing the results and preparing the volume of synthesis regarding the controlled production of discontinuities and its use in the development of deeply disadvantaged areas.
|
||||
|
Delivering the completed volume to the publishing house and completing 4 articles that will be sent to international magazines.
|
||||
A. Contributions to the academic approach of the concept of discontinuity, by grasping the mechanisms of genesis and the ways of employment
- Redefining the term discontinuity in territorial development;
- Stimulating reflection on the symmetry breaks in territorial development;
- Measurement of level of development in benchmarking and trans- scale analysis;
- Developing a rationale and methodology in order to use the production of discontinuity as a tool in the treatment of deeply disadvantaged areas;
B. Implemented Ideas
- Addressing the problems related to profound underdevelopment as emergency situations;
- The sketching and analysis of a deeply disadvantaged area;
- Distinguishing the profoundly disadvantaged areas at a national level;
- Scientific substantiation of policies and interventions to reduce regional disparities at the meso-and microscale, by inducing discontinuities;
- Shortening the implementation time of the mitigation policies for underdevelopment;
- Methods of remedying the deeply disadvantaged areas.
1. Articles published in ISI journals
Ianos Ioan, Peptenatu Daniel, Zamfir Daniela (2009), Respect for environment and sustainable development, Carpathian Journal of Earth and Environmental Sciences, 4, 1, p.81-93, http://www.ubm.ro/sites/CJEES/viewTopic.php?topicId=55;
Braghina C., Peptenatu D., Constantinescu S., Pintilii D., Draghici C., (2010), The Pressure Exerted on the Natural Environment in the Open Pit Exploitation Areas in Oltenia, Carpathian Journal of Earth and Environmental Sciences, vol.5, nr.1, pg.33-40, ISSN 1842-4090, http://www.ubm.ro/sites/CJEES/viewTopic.php?topicId=72;
Peptenatu D., Pintilii R., Draghici C., Stoian D.(2009), Environmental Pollution In Functionally Restructured Urban Areas: Case Study - The City Of Bucharest, Iranian Journal Of Environmental Health Science & Engineeringhttp://journals.tums.ac.ir/current.aspx?org_id=59&culture_var=en&journal_id=13&segment=en&issue_id=1781;, vol.7, nr.1, pg.87-96,
2. Articles published in B+ journals
Ianos Ioan, Cepoiu Andreea-Loreta (2009), The importance of intraurban structures of the romanian cities for crisis and emergency situations management, Revista Romana de Geografie Politica, an XI, 2, p 5-15 http://rrgp.uoradea.ro/index_files/2009_2.htm;
Ianos Ioan, Braghina Cristian, Peptenatu Daniel, Zamfir Daniela, Cepoiu Loreta, Pintilii Radu (2009),Geographical analysis of the higher education infrastructure in Romania, Studia universitatis Babes-Bolyai, Geographia, LIV, 1, p.19-34 http://www.studia.ubbcluj.ro/arhiva/cuprins_en.php?id_editie=392&serie=GEOGRAPHIA&nr=1&an=2009;
Ianos Ioan (2009), Romanian geographical higher education. Dynamics and challenges, Analele Universitatii din Oradea, Seria Geografie, XIX, p.4-12 http://istgeorelint.uoradea.ro/Reviste/Anale/anale_files/Last_issue.htm;
Ianos Ioan (2008), Respect for Space in Local and Regional Development, Revista Romana de Geografie Politica, an X, 2, p.5-14, http://rrgp.uoradea.ro/index_files/2008_2.htm;
3. Articles published in B journals
Ianos Ioan (2008), Spatial nanostructures. A theoretical introduction, Romanian Review of Regional Geography, vol.3, nr.2, p.4-16, http://geografie.ubbcluj.ro/cgr/index.htm;
Ianos Ioan, Zamfir Daniela, Peptenatu Daniel, Pintilii Radu-Daniel (2009), The individualisation of discontinuities in deeply disadvantaged areas of Romania, Romanian Review of Regional Geography, vol.4, nr.2, p.3-10, http://geografie.ubbcluj.ro/cgr/index.htm;
4. Articles published in international journals included in the BDI
Ianos Ioan, Cepoiu Andreea-Loreta, Pintilii Radu-Daniel (2009), Ungleichgewichtige intraregionale Entwicklung in der Region Nordosten Rumaniens, Postdamer Geographische Forschungen, 28, p.103-121.
Ianos Ioan, Cepoiu Andreea-Loreta (2009), Soziookonomische Folgen der wirtschaftlichen Umstrukturierung in der romanischen Dobrudscha, Sudoesteuropa Studien, 76, p.19-41.
Ianos Ioan (2008), A Major Challenge for Romanian Towns: The large habitats, (capitolul 5),In: Pomoroy, G., Webster G. (eds), Global Perspectives on Urbanization, University Press of America, Inc., Pennsylvania, 106-135.
Ianos Ioan (2007), Romanian experience in the defining of regional development policy, in Prvi Kongres Srpskih Geografa, I, Beograd, p.163-174, ISBN 978-86-82751-20-5.
Ianos Ioan, Heller Wilfried (2007), Minorities and image oflocal/regional in the context of globalization. Romania as case study, in Ethnizität in der Globalisierung, Sudosteuropa Studien 74, p.53-70.
5. Articles published in C and D journals
Ianos Ioan, Cepoiu Loreta, Pintilii Radu (2008), La fragmentation fonctionnelle du périphérique de Bucarest et le modèle d’un espace de soutien pour le développement de perspective de la capitale, Seminarul Geografic «D. Cantemir», nr.27, p.35-48.
Ianos Ioan (2008), The role of Romanian University in Local and Regional Development, Geographica Timisiensis, vol.XVII, 1-2, p. 17-31.
Ianos Ioan (2008), Remarks on the relationship between regional image and minorities in Romania, BSGR, XIII – XIV (XXCIII-XXCIV), p.39-57.
Ianos Ioan (2008), The role of Romanian University in Local and Regional Development, Geographica Timisiensis, vol.XVII, 1-2, p. 17-31.
Ianos Ioan (2008), Remarks on the relationship between regional image and minorities in Romania, BSGR, XIII – XIV (XXCIII-XXCIV), p.39-57.
6. Articles undergoing evaluation at ISI-rated journals
Ianos Ioan, Zamfir Daniela, Cepoiu Loreta, Stoica Ilinca-Valentina, La Dynamique Du Systeme D’enseignement Superieur Dans Un Pays En Transition - Etude De Cas : La Roumanie, Annales de Geographie.
Petrisor Alexandru-Ionut, Ianos Ioan, Talanga Cristian, Land Cover And Use Changes And Possible Influence Of Urbanization Processes In Romania, Environmental Engineering And Management Journal.
Ianos Ioan, Talanga Cristian, Vlad Liviu Bogdan, Draghici Cristian, Ethics Of Space And The Treatment Of Most Disadvantaged Areas, Revista Romana De Bioetica.
Attendance of international conferences:
1. Ianos Ioan (2007), Romanian experience in the defining of regional development policy, in Prvi Kongres Srpskih Geografa, Sokobania, Serbia;
2. Ianos Ioan (2007)Reflections théoriques sur la production contrôlées des discontinuités et le développement régional, Seminaire internationale, Initiative entrepreuneuriale et developpement regional, Bordeaux.
3. Ianos Ioan, Loreta Cepoiu, Radu Pintilii (2008), Räumliche Muster ungleicher ökonomischer Entwicklung in Rumänien,Am östlichen Rand der EU: Politisch-geographische, ethnische und nationale sowie ökonomische und soziale Probleme und ihre Folgen für die Grenzraumbevölkerung, Chisinau (organizata de Fundatia Volkswagen).
4. Ianos Ioan (2008), Spatial Nanostructures and Dynamics of the Territorial Systems. A Theoretical Introduction, International Conference – Regional disparities, Typology, Impact, Management, Cluj-Napoca.
5. Ianos Ioan, Loreta Cepoiu, Radu Pintilii (2008), The present-day indentity building of rural and urban communities in the Bucharest metropolitan area, P E C S R L - The Permanent European Conference for the Study of the Rural Landscape, 23rd Session - LANDSCAPES, IDENTITIES AND DEVELOPMENT, Lisbon and Óbidos
6. Ianos Ioan (2008), Respect for space in the local and regional development, The International Conference on Political Geography: Applied Political Geography in a New Contemporary European Borderland Context, Oradea.
7. Ianos Ioan (2008), Rolul universitatii romanesti in dezvoltarea locala si regionala, The 8th International Conference: Local and Regional Development – Potential, Politics, Practices in theCentral and South-Eastern Europe, Timisoara.
8. Ianos Ioan, Cepoiu Andreea-Loreta, Stoian Daniela (2009), Present-day Features and Development Perspectives of the Poorest European Union Region: Romanian North-East Region, Understanding and shaping regions: Spatial, social and Economic futures, Leuven, Belgia.
9. Ianos Ioan (2009), Spatial nanostructures and territorial systems dynamics, Seminaire internationale, Initiative entrepreuneuriale, developpement regional et dynamique territoriale, Bucharest-Sinaia.
| As a part of the work project in 2007 stage, the two recommended objectives were induced: 1.establishment of the basic concepts and the theoretical relationships between them; 2.settlement of the criteria and indices assembly in order to individualise the thoroughly disadvantaged areas at the national level. 1.In attaining the first object, some further activities were induced, in order to get reference material endorsing the concepts of “deeply disadvantaged area” and “discontinuity”, discussing and deliberating again upon the two concepts, the theoretical measures of treating these areas inclusive.The individual documentation on those aspects consisted in researching some works in the field: - Regional Policy in Europe, în Regional Policy and Development Series 11, Jessica kingsley Publishers, London and Bristol, Pennsylvania, 1997, (autor Artobolevskiy S.). - Sisteme teritoriale, Editura Tehnica, Bucuresti, 2000, (autor Ianos I.). - Transition, Cohesion and Regional Policy in Central and Eastern Europe (eds. J.Bachtler, R.Downes and G.Gorzelak), Ashgate publishers, Aldersholt, 2000. - Less favoured areas and regional development in Romania, în “Regions and Cities in the Global World, Essays in Honour of Gyorgy Enyedi (ed. G. Horvath), Centre for Regional Studies, HAS, Pecs, 2000 (autor Ianos I.) - Domestic Migration and Economic Policies in Post-totalitarian Romania, Restructuring, Stability and Development in Southeastern Europe (Conference Procceedings), University of Thessaly, Volos, 2001 (autor Ianos I.). - La region: essai de definition, Annales de Geographie, 1962 (autor Juillard E.) - Regional Development, Regional Policies and Regional Planning, Regional Studies, 4, 1970 (autor Kuklinski A.). - Carta Verde, Politici de dezvoltare regionala în Români The concept of “deeply disadvantaged area”. Deeply disadvantaged areas, in essence, represent the least developed areas in a region, as a result to an assembly of factors which generated the intense underdevelopment extent. The definition of these types is very important in the efforts made by the country or by local and regional communions to reduce the territorial strains, generated by the highest discrepancies in the process of development. In correlation with the policy of regional development a major part of deeply disadvantaged areas is included as a priority in the process of regional development policy implementation. The evaluation of deeply disadvantaged areas should take into account two basic elements: “the scale of analysis” and “time”. The scale of analysis is very important , because at the national level there is another index in measuring the specific indices distribution, in comparison with regional level index. The non-affiliated areas to previous class can be disadvantaged at regional or local level. The intensification of some problems become more and more clear and individualized at the inferior levels of the territorial units. At the same time, we may take into account the regional development degree, which can have a great impact upon the actions in establishing the most disadvantaged areas. The existence of some small areas deeply affected in a developed region is a disaster, despite the fact that this region is not below the extent of another one similar to it in an underdeveloped region. In the second case, the disparities between the advantaged areas and disadvantaged ones are not so important, but they have a great impact on the local level. The concept of discontinuity. The idea of discontinuity lies in the work of the French Geographer Camille Vallaux who, despite all opinions at that time, namely that “the slot is only stretching”, said that the slot can be characterized by “diversity” and “contrast”. The slot is defined as a hiatus without gradated transition between the two features of an entity individualized in a certain region. According to the same writer, “diversity” means also that the transitions are induced step by step between two features of the same entity, not being detected by the human eye. The ideas expressed by Vallaux were, for a long time, forgotten in the debating circles. This society showed interest in the continuity elements of a region, which continuity was expressed itself by homogeneity. The followers of the Vidalian Geography considered that the homogeneity regions should have priority. They were analyzing these regions without noticing that the elements which gave this homogeneity made them much more complex. For these followers the assembly was the result of some progressive phases from one region to another, the morphological elements being emphasized. The conclusion is that the Geographers, being interested in the continuity of the slot in the twelfth century, neglected the feature of discontinuity, which provided territorial flows and the standing complication of territorial units. Analyzing the synergy and the territorial parts we can draw the conclusion: “Territorial synergism provides unity to the territorial structures” and they are expressed by a specific way of territorial structure. The territorial synergism determines the orientation of the territorial flows from and towards some center points of convergence. The creation of the discontinuities take place continually through a system of relationships which has as a basic element the filtration of territorial flows. The production of discontinuities is correlated with interactions, but also with autonomy tendency of some entities. The whole world structure is based on systems of discontinuities, which can be clear or vague, but the consequences are the same on the whole. The general effervescence, which emphasized more and more the results of demographic increasing and economic structure, is the basic element of the discontinuity production. As a consequence, the global slot is fundamentally discontinuous. Due to the relativity of the two concepts, the general idea is that “the unity of the slot is expressed through elements of continuity, concretely through the unification of disparities and its diversity is provided by discontinuities which separate a unity from entities”. The importance of discontinuities is essential in this separation, because they allow the individualization of territorial structures. In comparison with spatial structures, the territorial ones have a great impact on human communities and have in view aims which are included in the process of administration the territory they own. On the basis of the theoretical documentation and thoroughgoing study of the two concepts, a leading article has been founded. This article, reffering to disparities and anomalies in the capital region- Bucharest- , will be sent to publication. 2.In attaining the second object, on the basis of analyzing experiences in order to emphasize interregional differences of the research group, some recommendations were made concerning the criteria and indices set with a view to measuring the differences in the development process on a very small scale. In the process of individualization the development stages were taken into account. These stages were evaluated and registered in elementary administrative departments. Because of the statistic evidence, lacking in basic indexes, a decision had been made, namely to use only 8 indexes, for example: death rate, birth rate, density of population etc. After standardizing the final results and obtaining a general index of development for each area, they acquired relatively their homogeneity. As a rule, in analyzing deeply disadvantaged areas and finding specific treatments we should take into account the following steps: - the usage of a proper background for identifications of deeply disadvantaged limits; at national level one can use districts or groups of districts; but at the regional level one should take into account the communes; - the individualization of decisive factor or factors set responsible for a lower degree of development; - the evaluation of territorial impact in the affected area; - the capacity of intensification and stopping some territorial components in the social and economic life dynamics of the region or country. Using the previous technology, 40 deeply disadvantaged areas were discovered, distributed in 7 areas out of all 8 advantaged ones (the region of Bucharest has a high degree of development, in conclusion it hasn’t disadvantaged areas). The most affected regions are situated in south(seven), north- west, south-east( each of them with six areas). It isn’t very important to know the number of these areas, on the contrary one should pay attention to the population and even to the administrative districts which are affected. The geographic distribution of these areas show us that many ones are in south, especially in the plain and in the mountains and hills of Transilvania. In Moldova there are few affected areas. The identification of deeply disadvantaged areas is very complicated in Romania, because more areas could be discovered in each region. Which are the most affected areas? In this case, it is necessary to distinguish specific criteria for each level, national and regional. The main criteria for the identification of deeply disadvantaged areas are: o the territorial adjacency of geographic areas; the existence of at least 5 elementary units (communes and cities), with direct vicinities which should allow their territorial aggregation; o the global indicator should be situated with 25% below the global indicator of the disadvantaged area which corresponds to it or with 75% below the indicator of the developing region; o the functional homogeneity of disadvantaged area; o the value of at least one of all elementary indicators at the minimum level of the country or at the minimum level of the region; o the existence of some striking breaches in the levels of territorial development; o the negative territorial impact upon all vicinities of the area; The information underline individualization of the real disadvantaged areas, the lack of some essential pre- requisites( for example the unemployment rate in a commune, which is impossible to calculate), also the estimations bound to the real delimitation, have a subjective role. In spite of these debatable issues, the reality upholds the existence of the areas, as being the most backward ones in the country. The results obtained through out the real circumscription of deeply disadvantaged areas can make up a powerful push to deciders in the thoroughgoing study of the problems, to the proper evaluation of their real potential, to the elaboration of some local patterns regarding the behavior of the “actors” and the population in order to lead in the alleviation of the discrepancies in the development stages. In conclusion, it is extremely important to continue studying these useful analyses taken upon each affected area and through out developing strategies which should be induced to Agencies of Regional Development, inclusively to the National Development Agency. The former one can even co-finance such sort of studies, which can substantiate the territorial development opinions. |
|
Within the work plan stage for 2008, two proposed objectives were achieved: the construction of a database of relevant indicators for measuring the levels of development at the basic territorial level and the spatial demarcation of deeply disadvantaged areas. The aims achievement was done by a number of activities:
• Prospecting the institutions able to provide some significant indicators in the individualisation of deeply disadvantaged areas.
• Debates on the method of substitution of some indicators with others with similar valences in the reflection of reality.
• Collection and storage of statistical data and geographic information necessary in the individualisation of deeply disadvantaged areas.
• The identification of deeply disadvantaged areas having as landmark the entire national area.
• The identification of deeply disadvantaged areas having as landmark the development regions.
• The comparative analysis of advantages and disadvantages of each of the measurements and the option for one of them.
1. The construction of the database
The detailed analysis of highly disadvantaged areas was supported by a hefty database relevant to measure levels of development, at the basic territorial level.
2. Theoretical considerations
The regional development is one of the main goals in the policies of complex development of nations, especially those in transition from centralised to market economy. The experience gained by Western Europe countries in the field of regional development has shown that better territorial distribution of resources, in addition to a high exploitation of the complex of potential elements existing at the local or over local level become factors of economic growth and social equity (Kuklinski, 1970). Often, two notions are used as basic concepts: developed region and disadvantaged region. In order to highlight some priorities we could distinguish a subset of disadvantaged regions, namely the deeply disadvantaged regions.
A major challenge is developing a methodology by which to identify and analyze the regional disparities through a systemic approach, at the level of the smaller administrative unit, so that the interventions of decision makers to be effective.
The final objective of all actions related to the implementation of a regional policy is to reduce the gaps, the disparities among different territorial units, considered to be relatively homogeneous. In order to achieve this objective, four stages are distinguished: the acceptance of regional development policies, the identification and analysis of regional disparities and defining the regional development policies and the implementation of these policies.
The acceptance of regional development policies by policymakers is a prerequisite for starting the territorial diagnosis at nano structural level able to differentiate territorial disparities.
In regional analysis is, however, very difficult to detect extremely disadvantaged regions, because the region is a vast space (the largest divisions in a state, after Juillard, 1966), with many subspaces placed on different levels of development. Therefore, in order not to introduce confusion in dealing with development issues, using the concept of area and not deeply disadvantaged region is recommended.
The concrete situation of Romania, with a general level of development much bellow the European average and even the countries of Central Europe, with large regional gaps, involve the adoption of flexible policies for regional development which take account of the impossibility of an overnight mitigation of these gaps, on the one hand, and of the very low financial resources available to induce an accelerated economic growth in lagging regions, on the other hand. In this context, the concept of deeply disadvantaged area, the individualisation of these areas at national level and the methods for their treatment are important aims of regional development policy in Romania.
The regional development policy, part of the macro stabilisation and territorial development policy, has its beginning in the old concepts of harmonious or balanced development of all counties of the country. It was a time when the dominance of central decisions and the top-down guiding of investment created the impression of an attenuation of territorial gaps, taking as a basis for evaluating and monitoring the county. The emphasis almost exclusively on the development of industry, its artificiality has led to a development focused less on economic efficiency and competitiveness and more on “the full use of the workforce”. The failure of this policy was predictable, and the transition to the market economy proved particularly harmful effects of extensive industrialisation in a time when competition in a free market dictates local or regional forms of development.
The adoption of the regional development policy. As a result, the years since the fall of the totalitarian regime and the need to connect to European value systems, demonstrated the need for adopting sustainable regional development policies that would take into account that real economic growth can be achieved by exploiting the strengths of each region and each place and by diminishing the effects of the weak points of each regional area. Consequently, since 1995 the principles underlying regional development has been accepted, including the development, within a PHARE program, of a policy in the field. This program running for two years, since February of 1996, has as a result the development of The green card of development policies in Romania, of some laws and governmental papers and other basic materials, establishing the institutional framework and implementation tools of this policy.
Thus, on the basis of this program, the development and adoption of the low on regional development in Romania (promulgated on July 13, 1998) started, a fundamental law for on appropriate and coherent policy of territorial development. Through this law the institutional framework was established, represented by appropriate central bodies, but also by functional bodies at the level of the 8 development regions. An important element in the demarcation of these regions was the population criterion, meaning the exceeding of a threshold of 2 million inhabitants in all cases to which other criteria have been added such as functional complementarity.
These territorial entities resulted from the voluntary association of counties, and one of the most important decisions that followed was the choice of location of the 8 future regional development agencies 8. The criterion of central functionality and maximum accessibility was not decisive everywhere, some counties that felt frustrated during the Stalinist regions, when their residences were overlooked, or were directly against the future agency location in the largest cities in the new development regions. Thus, in the North-East Region, the residence was established in Piatra-Neamt not in Iasi in the Central Region in Alba Iulia and not in Brasov or Târgu Mures (it is interesting that Alba Iulia has refused even from the start the membership in the same region as Cluj County, from the fear that the latter’s residence to put Alba Iulia in shadow), in the South Region originally in Alexandria and then in Calarasi and not in Ploiesti or Pitesti, in the South East Region in Braila and not in Galati or Constanta. The decisions were taken exclusively at the counties association level and not at central level.
In the process of economic restructuring the social pressure was particularly strong, especially in mining activities. To mitigate the shock produced by the massive layoffs in this area, in 1999 the Low 20 was adopted, which established the 24 disadvantaged areas considered priorities and that enjoy the facilities granted to investors to mitigate the effects recorded as a result of economic restructuring.
Defining disadvantaged areas and their development problems. According to the Government Decision HG 191 – HG 210/1999 and Law 20/1999, disadvantaged areas are those geographical areas strictly defined in territory, which meet at least one of the following conditions: a) have mono-industrial structures, which mobilise more than 50% of employment in the activity of the area, b) are mining areas where the staff was dismissed by collective redundancies as a result of restructuring programs, c) as a result of the liquidation, restructuring or privatisation of some economic agents collective redundancies occur affecting more than 25% of the number of employees who have permanent residence in the area, d) the unemployment rate exceeds with 25% the national unemployment rate, e) lack of communication means and the infrastructure is poorly developed.
3. The spatial demarcation of deeply disadvantaged areas
As a result of a first analysis undertaken at national level 24 disadvantaged areas located in 12 counties were identified. It is interesting that after these criteria and by how they were defined territorially the disadvantaged areas at national level represented more than 5% of the country, occupying 12,000 sq. km. At county level, the largest area held by disadvantaged areas was in Suceava County (38%), extending almost throughout the mountain area. Next, in order are following Caras-Severin with about 28% (2,370 sq. km.), Maramures (26%) and Gorj (23%). No accurate estimations were made for Hunedoara and Alba Counties, but by the same methodology, the share in these exceeded 30% and 20%.
The application of the facilities provided in Law 20/1999, at the level of these very extensive areas and not always consistent with reality would have led, perhaps, at great losses of the national budget. Therefore, these disadvantaged areas that practically are mining villages affected by the mining restructuring process and mass redundancies are reconsidered. There is not always a perfect identity between a disadvantaged locality and a disadvantaged area and the range of the number of people belonging to these areas is very high. For example, even within the Gorj County there is a big difference between the Motru-Rovinari area and Schela, which is narrower.
Consequently, the main disadvantaged areas, 24 in number, are three mining towns in each of the counties of Caras-Severin, Bihor, Gorj si Salaj, two in each of the counties of Hunedoara, Maramures si Prahova and one in Bistrita-Nasaud, Harghita, Covasna, Bacau si Tulcea. The disadvantaged areas mentioned had this status until 2008 or 2009, a strangely fixed timeframe, taking into account the very different complexity of these disadvantaged areas. Thus, in a much narrower timeframe the impact of restructuring the mining industry in the area of Ip and in the other for the Jiu Valley will be solved, where there is an entire urban agglomeration, focusing exclusively on mining.
Already in the first three months of operation of the assistance process for the 24 disadvantaged areas several important facts have been noted. Thus, in the records of regional development agencies are about 460 investors, who have created over 2,700 jobs number that will soon double. Apparently high, this number does not nearly cover the number of redundancies or those looking for the first job.
At the level of region investments that can be classified as promising already exist, given their volume and especially the very short time elapsed from the implementation of law. Thus, the largest investment appears to have occurred in the North-Eastern region, where 111 foreign and domestic affairs are conducted. Of these, only 18 met the criteria for receiving an investor certificate, the rest possessing provisional certificates. The social capital of traders who have invested here it amounted to about 60 mild. Lei. Major firms from countries like Germany, Holland, Switzerland, Israel started business, the main area of interest being the woodworking industry, plus clothing and knitwear industry and milk processing.
Such investments, although not large (the largest being of 13 million dollars in Gura Humorului town) demonstrates the potential of attraction that such areas have and especially the attraction due to very low taxation. As a result, such a statute can bear fruit when it is well defined and applied.
In these circumstances, the studies aimed at deeply disadvantaged areas appear as a necessity, using, through tax instruments, the inherent potential of these areas, in the conditions of attraction of major foreign or domestic capital. Since these areas have a high degree of accessibility it can be bet even on a high attraction to potential investors.
It is clear that Romania has, indeed, many disadvantaged areas, some of them very extensive and that to these were added others exclusively generated by the typical phenomena of the current economic restructuring. Among these disadvantaged areas, some are particularly deep, requiring its own strategy of development and that should not be treated as disadvantaged areas determined by a single element.
To establish the disadvantaged areas in a region or a state, a very good analysis at the level of the smallest administrative or other division is necessary, using a variety of indicators characterizing the main socio-economic fields: economy, human potential, infrastructure, social status, cultural behavior of local communities.
Basically, we could assimilate the concept of disadvantaged area with problem area, even if the notion of disadvantage leads to a global perspective in regional approaches. So these disadvantaged areas are composed of different groups of communes and cities, whose features are well below the national or regional average.
Disadvantaged areas can be divided into two categories:
- special disadvantaged areas, defined by one or two features, placed below the national or regional average (for example, areas affected by high unemployment, areas with high soil degradation, polluted areas , isolated areas, etc)
- global disadvantaged areas, revealed by the values of several indicators which represent a variety of parameters below the or regional national average (for example, areas with poverty, areas with very poor infrastructure ). Most of these types of areas are superimposed on clearly defined geographical areas where there are one or two restrictive natural elements (Danube Delta, Apuseni Mountains, Petrosani Depression).
The identification and analysis of territorial disparities are based on statistical indicators differentially selected for individualisation and analysis, the first category comprises indicators selected according to aim of the approach in order to capture the best territorial reality. The support indicators are used to capture in detail the determinants of regional disparities.
The system of indicators used to identify regional disparities includes four classes reflecting the demographic status, the economic status, the infrastructure and the standard of living, each class regarded as equally affecting the development.
Demographic status was assessed based on three indicators: intensity of depopulation, the share of population over 60 years and vitality index as the ratio between total population and population with stable residence. This ratio captures the attractiveness of some localities for floating population usually attracted here for economic activities.
The economic status was assessed on the basis of five indicators: economic dependence, the share of unemployment in the working population, the share of population employed in the active population and physiological density.
The infrastructure, an essential item of development was analysed on the basis of a complex set of indicators which includes: living area per dwelling, modernity of road infrastructure (as a ratio between the length of upgraded street and total length of streets) and medical infrastructure index (number of pharmacies per 1000 inhabitants).
The standard of living has been quantified by a set of indicators that directly or indirectly capture the quality of life: the share of population working in agriculture of total working population, housing with running water share of total housing, living area per inhabitant, the share of dwellings with bathroom in total housing, net migration, the share population college or university graduated of total population. The share of population employed in agriculture shows in the current socio-economic context that individualises large geographical areas in which this indicator has high values. The net migration is an indicator that captures the flows of population, particularly working population, arising from areas with low living standards. Assessing the standard of living by college or university graduate population share and in total population was achieved starting from the idea that an educated population has higher requirements to housing conditions and social and economic environment of a settlement. Also, an educated population is distinguished by the quality of participation in the development and decision process.
|
|
The individualisation of discontinuities in each deeply disadvantaged area
In the treatment of deeply disadvantaged areas is essential to dissect their internal structures and to individualise the main mechanisms that determine changes at micro-and medium-scale. In this regard, an important step is to detect the discontinuities related to development in the deeply disadvantaged areas. Even if the spatial projection of such discontinuities at micro scale seems less legible, it is essential to know the morphogenesis and to individualise the main factors in their development and disappearance.
Ascertaining the indicators that lead to the individualisation of discontinuities within each area
Analyzing the statistics and real possibilities to measure, quantitatively and qualitatively, the main components able to indicate the levels of development of basic units of a deeply disadvantaged area, a comprehensive list of indicators was shaped. Some of them are only qualitative expressing: the general physiognomy of settlements, the infrastructure maintenance level, overall behavior of the population and the assessment of the creative capacity of communities. The difficulty in measuring these indicators led to the use of an assessment scale from 1 to 100, in the area concerned. Statistics, namely the information contained in the BDL and in the census volumes of 2002, provides mainly demographic and less economic information. Moreover, the local economy and infrastructure are deprived of information that leads to a direct assessment of the types of activities and their intensity at commune / city level.
In these conditions, the quantitative indicators used are largely those used in the individualisation of deeply disadvantaged areas. They were grouped into four broad categories, reflecting the demographics, economics and workforce, infrastructure and standard of family life. The analysis of elementary indicators in terms of concrete values led to the establishment of the following system of indicators:
- demographic indicators: the dynamics of the number of population between the last two censuses (%), the net internal migration (% 0), the infant mortality (% 0), the share of population graduated high school and higher education (%)
- economic indicators: the number of firms per 1000 inhabitants (% 0), the turnover by communes (Euro/inhabitant), unemployment rate (%) share of unskilled workers in total employees (% )
- infrastructure indicators: the share of dilapidated buildings (%), the share of housing completed in 2005 of total dwellings (%), the number of pharmacies per 1000 inhabitants (% 0)
- indicators of standard of living: habitable surface per inhabitant (m² / inhabitant), the share of population without running water (%), the number of doctors per 1000 inhabitants (% 0).
Development aggregate index values vary from one area to another, according to its extension and the existence, in general, of a city of over 10,000 people within it. This explains the fact that the largest range of variation is noted in the deeply disadvantaged areas selected from the North-East region (NE2, for example, recorded a range of about 20 units) and the South region (S4, with a range of almost 16 units).
The processing of the quantitative indicators was made after standardizing them. The result was a specific development indicator for each commune / city, which later was mapped. The qualitative indicators were used only to correct and justify the method of aggregation of some basic administrative entities within the deeply disadvantaged area.
The demarcation of characteristic areas by refining the analysis at the level of each deeply disadvantaged area
The basic idea around which the concept of treatment of deeply disadvantaged areas was build has been to individualise, at the level of each of these areas, characteristic spaces with similar values of the development level. Obviously, overall, the entire selected area is low developed, but considering the extension and functional complication, including within their interior, differentiation processes take place, which suggests the need for controlled interventions at these levels.
The method of delimitation of characteristic areas was based on the values recorded by the general index of development of each commune / city. The main steps in the demarcation process were the following:
a) the cartographic transposition of the development index values obtaining maps with specific values of each commune or town
b) the aggregation of the relatively homogeneous areas at the sample scale (we mention that the analysis was conducted on selected areas, resulting at national level, 48 entities
c) the determination of the level of development in relation to the average level of the area analyzed and qualitative assessment of the development level
d) the correction of primary aggregations by taking into account qualitative indicators
e) making compromises in the generalization of the levels of development process, taking into account the geographical position compared to some urban or rural areas with central place functions
f) the proper demarcation of the characteristic areas of each of deeply disadvantaged areas
g) assigning codes to be more easily identified in the analyses and to facilitate, subsequently, the extrapolation of development models.
The selected areas have a very different structure. Despite the fact that these rise serious problems related to remaining behind, which explains their individualisation through obvious discontinuities in the development level of most indicators, by their extension show the existence of other internal discontinuities. This demonstrates the importance of multi-scale analysis in the spatial individualisation of territorial development phenomena.
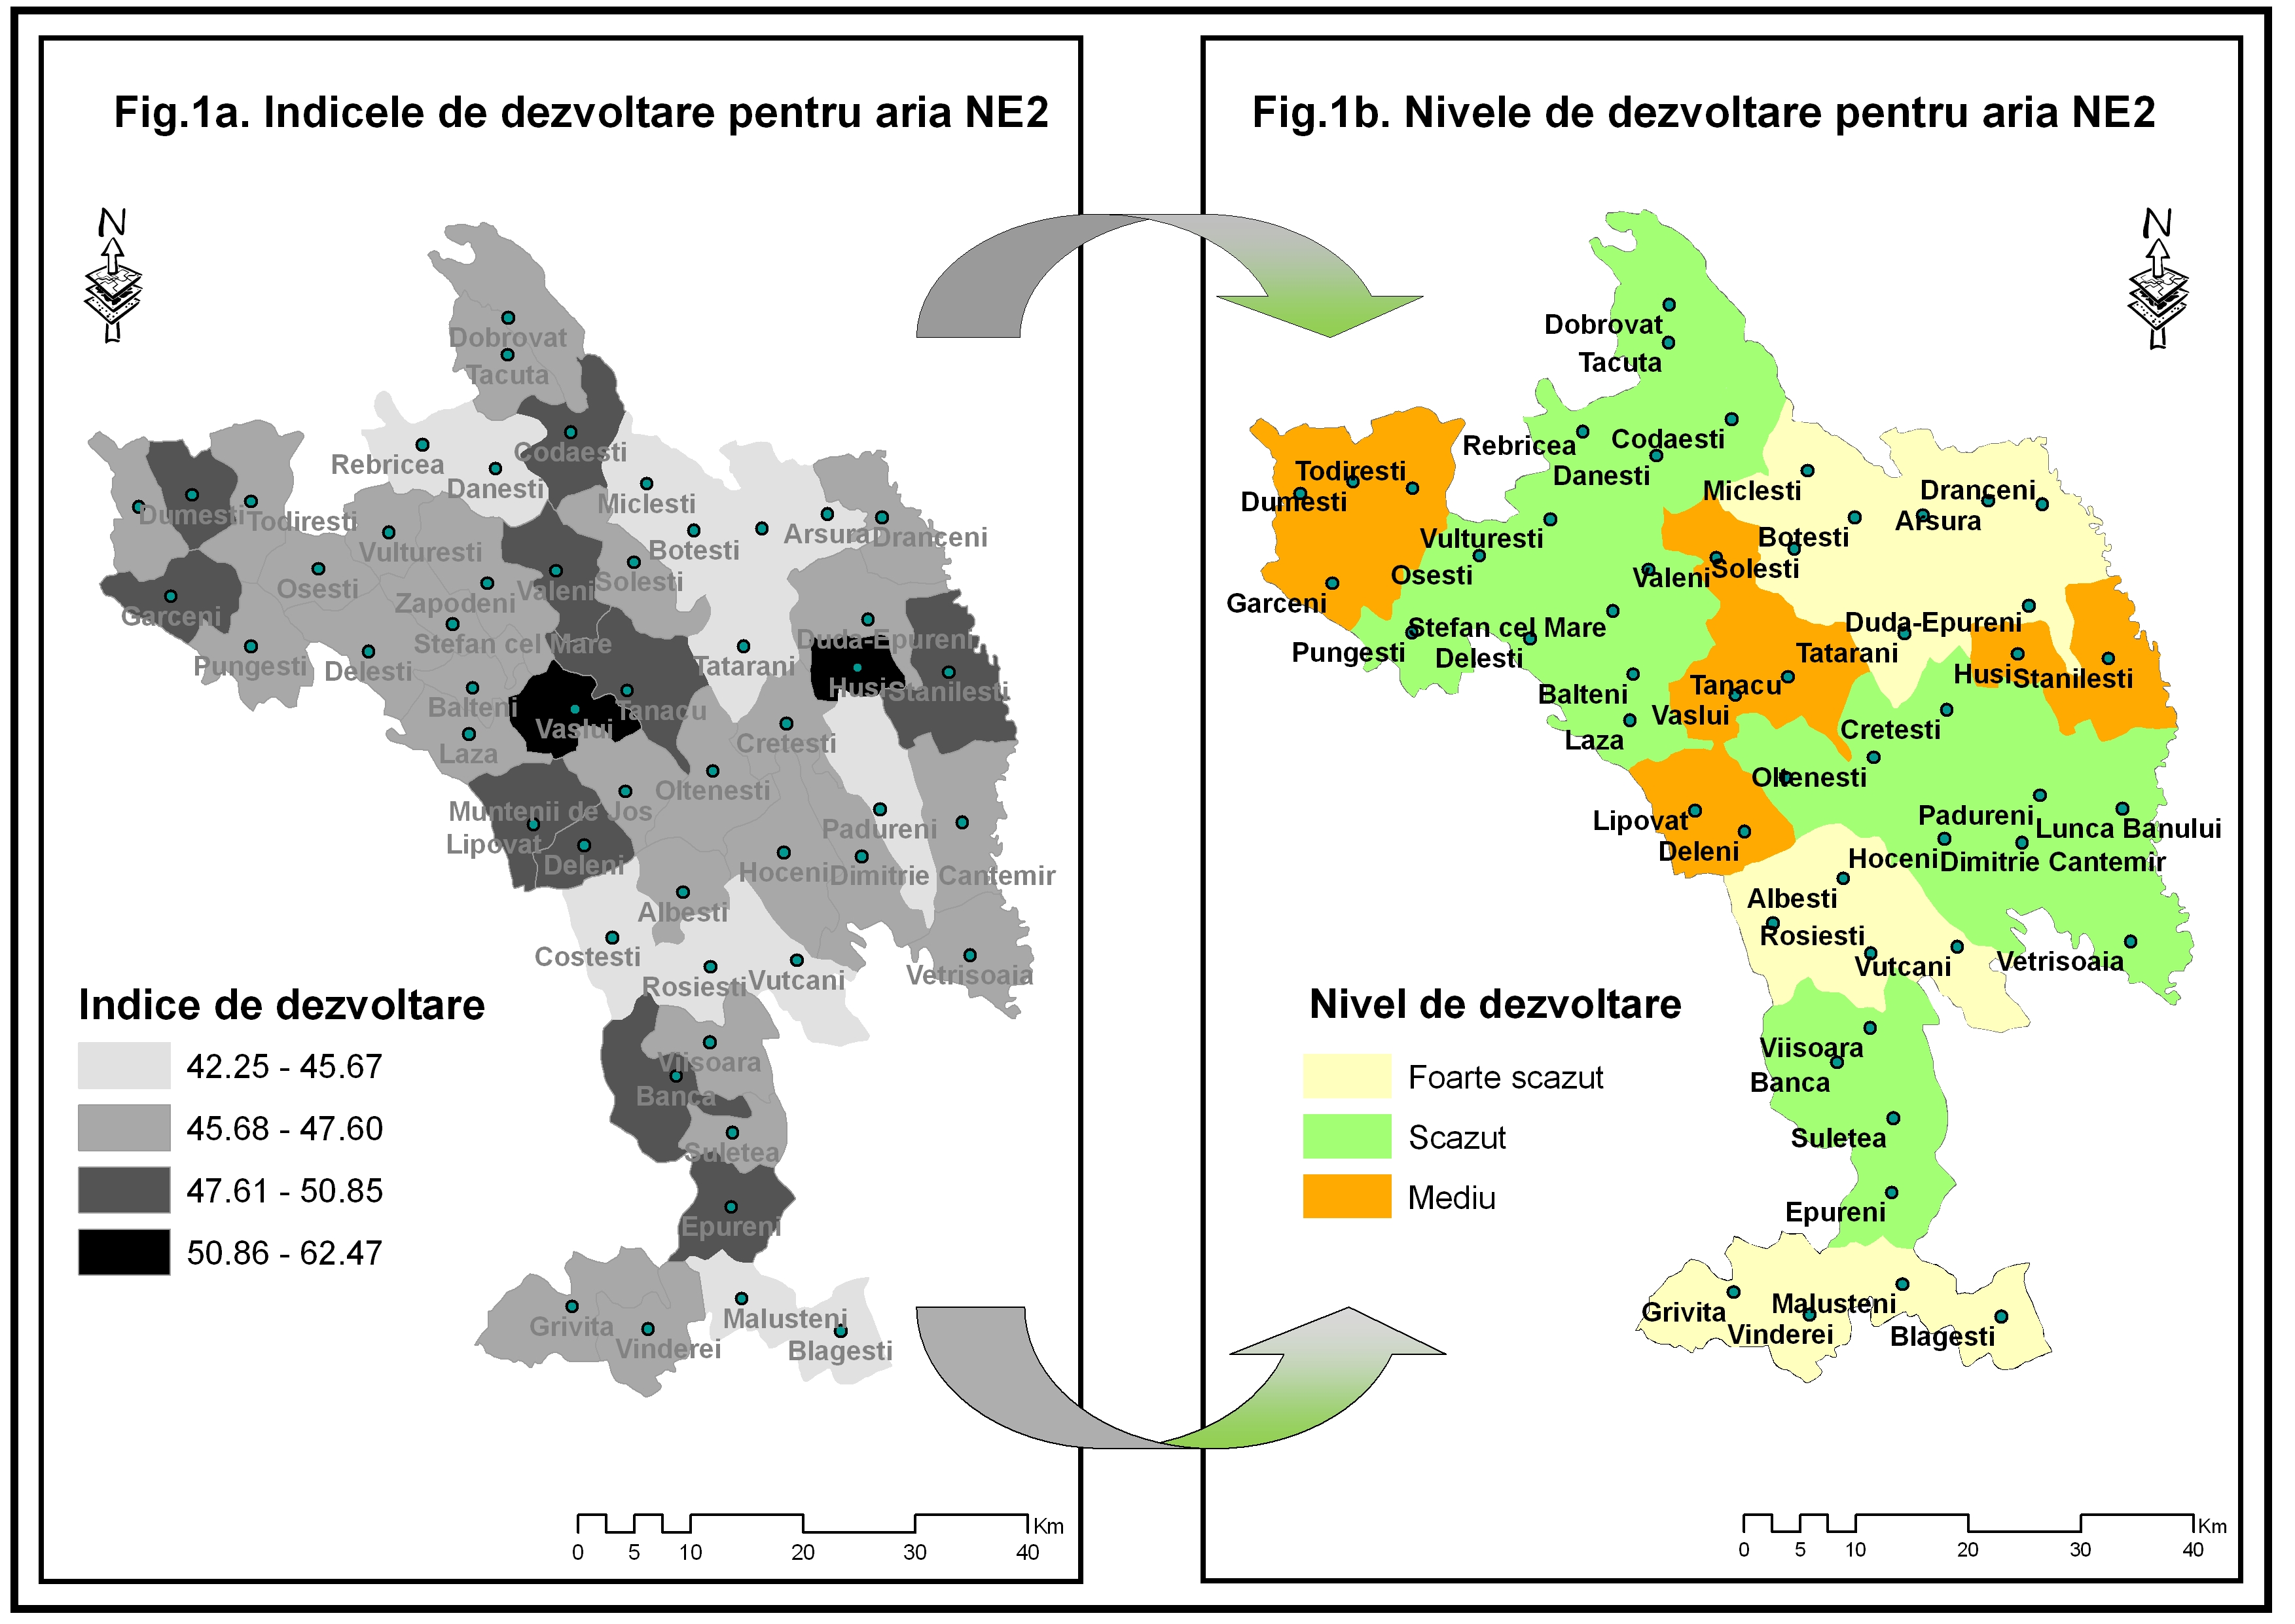
The demarcation of characteristic areas was made by generalizing the development index values, assigning a qualitative assessment to each new individualised area. The four types of assessment: high, medium, low and very low development, keep their compare force only within the selected area, due to the placing of the referential system at the deeply disadvantaged area level. In order to reflect the method of the results generalization in levels of development, we randomly present a deeply disadvantaged area with inter-communal differences (Fig.1) and the situation after generalization (Fig1.b).
The multitude of situations was an important effort of generalization, including some of the qualitative indicators, others of geographical position and, moreover, the purpose for which to recourse to such an internal review was always considered. The latter led to the idea of fragmenting a relatively homogeneous area in order to provide the basis of a subsequent functional building. A very large area, apparently homogeneous, but with opposite directions flows, cannot be managed in terms of subsequent treatment. Therefore, its fragmentation becomes a necessity for building an institutional framework to implement inter-local development policies.
The characterization of spatial discontinuities within each deeply disadvantaged area
The analysis of all the breaks occurred between the individualised characteristic areas highlights a variety of situations, depending on which results some types defined by: the depth of the gap, the homogeneity, the fragility and the duration of discontinuity.
In accordance with the depth of the gap we select few significant examples among the characteristic areas:
a) Deep discontinuities, individualised between areas with opposite levels of development, respectively between those with high development and low or very low development: between NE4c si NE4b, SE4a si SE4b, S3a si S3b, SV5a si SV5b, V4b si V4c, NV5e si NV5d, C6c and C6b;
b) Diffuse discontinuities or no discontinuities. Although they are not so obvious, boundaries were drawn, demarcating the characteristic areas that could be viable in the implementation of some real inter-local development policies. As examples, we mention the boundaries between the areas: NE3b si NE3f, SE3a si SE3b, S5a si S5f, SV1c si SV1f, NV2a si NV2c, C3b and C3c.
In relation to the discontinuities degree of homogeneity, meaning to maintain the same intensity of the discrepancies along a boundary, we note:
a) Homogeneous discontinuities, meaning the same gap throughout its length: NE3a si NE3b, SE3c si SE3d, S2i si S2k, SV3a si SV3b, V3a si V3b, NV1a si NV1c, C5a and C5b;
b) Heterogeneous discontinuities, with highly variable differences from one area to another: NE3c si NE3d, SE4b si SE4c, S3a si S3b, SV4c si SV4d, V3b si V3c, NV5d si NV5c, C6b and C6c.
The fragility of these discontinuities considers their trend of turning into continuities. Research has individualised those discontinuities defined as close gaps, which means a very high fragility and others defined by maximum gaps, meaning a reduced fragility. In other words, it is about the state of discontinuities, some situated at the "instability" threshold and others with a higher degree of stability. In this regard, there were individualised:
a) Discontinuities with high fragility, located in similar areas in terms of levels of development and where, usually, the gap between them must be emphasized. This category includes discontinuities such as those separating the areas: NE3b de NE3f, SE3b de SE3c, S7b de S7c, SV4c de SV4d, V4a de V4b, NV4g de NV4f, C3b and C3c;
b) Discontinuities with low fragility, located between areas with major gaps, which can hardly be dimmed: NE5c si NE5e, SE3d si SE3e, S3a si S3b, SV4a si SV4d, V4b si V4c, NV1b si NV1c, C5b si C5d.
Assessments of the duration of discontinuities from these levels could be made only indirectly, in the absence of real opportunities to compare two time sequences of the internal structures of deeply disadvantaged areas. However, the three categories of discontinuities were indirectly used in order to understand the mechanisms behind the production of discontinuities.
The knowledge and completion of the mechanisms capable of producing discontinuities
From the detailed study on the characteristics of the areas within deeply disadvantaged areas, the mechanisms that produce spatial discontinuities and induce their dynamics have been known and described. In such action, the first step was individualising the factors that may cause discontinuities, ranking and analyzing the interactions between them.
The individualisation of the potential factors that generate discontinuities
Many of the current discontinuities come from historic times, since we discuss about deep rural areas, where the development was extremely slow, and phenomena such as depopulation, could have only adverse effects. The variety of practical situations led us to the idea that we can talk about a very large variety of factors with determining role in the dynamic of discontinuities. Among these factors, the historical, economic, demographic, cultural and political ones stand out. Natural factors are rather premises of the process of discontinuities morphogenesis, blocking or amplifying the differential development trends at micro-scale level. Historical factors have a great impact on the discontinuities at this level and are found in the territorial-administrative structures, in the first place. Being involved areas at micro-scale level, the gained or lost function of center of commune, was essential in the development of a community, in changing the hierarchies at the base of settlement systems. To the differentiated developments of the territories at this level, the cultural heritage and local policies promoted consciously or unconsciously contributed.
But the most important direct impact on spatial discontinuities morphogenesis at micro-scale had the economic and demographic factors. The quality of demographic characteristics, for a long time appeared to be inversely proportional to the level of development. Thus, communes with a high natural growth had a low level of development, while those with an aging population were at the opposite pole.
The generalization of the level of training and disseminating good practices seem to cancel the historic advantage and the one of traditions related to infra local space organization. At the same time, the existence of only one type of resources and the practice of a subsistence economy had an impact on the current level of development of some specific areas.
At the level of each category of factors elementary factors are individualised. Thus, historical factors include the infrastructure legacy (physical and social), administrative organizational structures, historical function of some settlements, cultural factors refer to intangible cultural heritage, customs and traditions in the area management, the population mentalities, religious beliefs and their spatial projection and political factors refer to the succession of decisions taken at different levels and their impact on territorial management at micro-scale. This last category of factors had severe adverse effects on deeply disadvantaged areas through the cooperativization processes, after the soviet model. It was found that there is a development gap between the collectivized communes and those in which private property has continued to exist, to the advantage of the latter. The discontinuities generated by such decisions are noted at the level of some deeply disadvantaged areas covering the mountain area, as well as the depression area (V2, NV1, NV6, C7).
In the category of economic factors, we note those which were the basis for industrialisation, agricultural development and tertiarisation (including also natural resources). The industrialisation policies promoted during the totalitarian regime produced large discontinuities at the deeply disadvantaged areas (NE5, NE3, S5, SV2, V2, NV6, C7). The transition to market economy has maintained the same discontinuities, but promoted by the loss of located industrial activities as a result of some wrong decisions. Demographic factors can be summarized in the following subcategories: those related to the natural population growth, to short distance and long distance movements with two directions: internal and external. The impact of these factors in producing discontinuities is very different and difficult to assess, in relation to the development process. This is because, statistically, the rural areas with many immigrants for work seem to be developed, due to the remittances, but on the long term these areas may be the major losers.
Their ranking in relation to the impact they have on the local and inter-local development
The diversity of the local and inter-local development process shows that making a global hierarchy of the factors generating positive discontinuities at those levels is difficult, considering that these are at the basis of territorial development. In the case of the most characteristic areas it seems that economic factors, combined with the cultural ones are deciding factors in the local development.
Regarding the inter-local development, the historical and political factors are fully exploited. The first exploit the role played by some rural or urban settlements in the local or regional history, the existence of functions related to the geographical position that favored the functioning of some localities as traditional fairs. The political factors are related to certain positions held by a number of settlements either as capital of ”plase” in the interwar period, or as district residence, which has imposed them in the local systems of settlements.
The method of ranking of factors generating development had on its bases the construction of a graph and an associated matrix for each of the characteristic areas among the selected areas. Marking the existence with 1 and the non-existence of a determining relation with 0, different values for each factor were obtained horizontally. Depending on the sum of these values, the ranking for each characteristic area of the factors impacting on local development was made. In the deeply disadvantaged areas selected, by characteristic areas, it was revealed that agriculture revitalization has more than 37%, local industrial exploitation of agricultural products 23%, 21% SME development, the remaining 19%, returning the other factors.
The identification of interactions chains in the moment of stimulating one of the factors and the estimation of the effects on the development
In order to estimate the effects on the development an attempt was made through identifying the route of amplification of the influences of a factor in the case of its stimulation. It is clear that developing an area of the internal structure of a deeply disadvantaged areas is made only by inducing a change at the level of one of the of the factors. Simulations revealed two types of chains of interactions: one that means diffuse interactions in time (generated by the change produced in a spatially extended area), and the second, characteristic of relatively rapid interactions determined by implementing a precisely oriented activity like industry or services.
The most durable chains of interactions are built with a precisely oriented productive activity as a deciding factor: industrial exploitation of wood or agricultural products, or of rocks or minerals. These chains have an activity of agglomeration of other activities, resulting in an economic diversification of the characteristic area. Simulations for characteristic areas within NE5f, SE4d, S5c, SV2, V6, NV1c, C3d, confirm the amplifying effects of these precisely oriented interventions, exploiting local resources through SMEs.
For example, in the case of SE4d area, expanded on the territory of 6 communes, if there is an intervention through stimulating the development of agricultural exploitation activities in this area at the level of Balta Alba, successive changes in the use of agricultural land of the communes Gradistea, Vâlcelele, Boldu, Galbenu and Ghergheasa will take place. Much of the agricultural products obtained will generate streams converged to Balta Alba. The increase in the income achieved from the real possibility of exploitation of agricultural products will result, at economic level, in the revitalisation and the diversification of service activities. Multiplying these activities will have direct effects on local demographics, decreasing the definitive departures, on the physical and social infrastructure, on the training level of the population. Obviously, the main effect will be the construction of a new gap between Balta Alba and the other communes, the first following to be pushed outside the area and turn into a continuity.
The detection of the main factors, generators of discontinuities in each selected deeply disadvantaged area
The obtained results were the basis for the individualisation of the main factors that may cause the emergence and development of a discontinuity at the level of characteristic areas in deeply disadvantaged areas. These were very useful to characterize the internal environment of each area.
The analysis of the internal context and external environment adjacent to each deeply disadvantaged area
The internal context is shown by the different structure of each deeply disadvantaged area, taking into account the particularities of the characteristic areas. We distinguish, thus, very complex areas like those in the North East and South Regions, but also others, relatively simple structured as in the South-West, West or North-West Region. For example, the NE5 area has 3 areas with average levels of development, 2 with low levels and 4 with very low levels. In contrast to this complex situation, we note the SV2 area, with 2 areas with low levels of development and one with average level.
To this statistical approach, we need to add the geometry of the configurations that increase the complexity character. The discontinuities separating this type of areas are rarely linear, in most cases being very festooned. Hence, the difficulty of establishing generally applicable patterns in the treatment of such areas is explained.
The analysis of the external environment has highlighted the particular influence of several factors on the general characteristics of deeply disadvantaged areas. Among these, it is notable the level of ruralisation, the density and quality of transport infrastructure, including the accessibility, the structure and the dynamics of the regional economy, regional settlement system characteristics, cultural differences. The reflection in the regional spatial structures causes an asymmetric aspect in the regional development, with breaks of symmetries on large areas (North-East Region, South Region, North-West Region) and an circular appearance in a developed regional area (West and Center Regions).
The emphasis of characteristic resources types that support the most dynamic factors of local and inter-local change
The activity aimed at achieving this goal was an inventory of resources individualised on each characteristic area of DDAs. In order of frequency of local and inter-local resources were noted: agricultural resources, forestry, the volume of labor (less its quality), tourism potential, mineral resources, best practices in managing space at a small-scale and geographical position (regarded as a resource).
The characterization of the main factors in terms of their ability to generate discontinuities that impact on development
For each of the main factors able to generate discontinuities at the level of characteristic areas and DDAs an analysis was undertaken, able to emphasize their ability to induce changes. As mentioned in one of the previous subsections, the factors with specific location are most recommended to produce discontinuities in development at different scales. Of these, industrial activities, the location of major tourist accommodation, of shopping centers, logistics centers or science parks are notable. The stimulation by tax incentives of the preferential location of these types of activities in localities with central place features directly and indirectly induces development to the adjacent areas. In relation to the characteristics of internal and external environment of the characteristic area, the alternative of stimulating the nearby urban or rural localities may be chosen and, from there the step by step diffusion may accelerate the development of the area and eliminate the existing discontinuity by producing others. The factors supporting the rapid translation of discontinuities and their elimination through development are characterized for each of the characteristic areas of DDAs.
The preparation of three articles that will be submitted for publication to ISI journals and of other 4 articles to be published in Romanian journals:
1. Articles prepared for ISI journals:
a) Present-day Features and Development Perspectives of the Poorest European Union Region: Romanian North-East Region – Autori: Ioan Iano?, Daniela Stoian, Andrei Csaba Schvab;
b) Electoral behavior of the population from the most disadvantaged areas from Romania – Autori: Ioan Iano?, Cristian Talanga, Loreta Cepoiu, Radu Pintilii;
c) Role of the Romanian universities in the development of the most disadvantaged areas from Romania - Autori: Ioan Iano?, Cristian Braghina, Peptenatu Daniel, Draghici Cristian.
2. Articles prepared for Romanian journals:
a) Metodologia tratamentului ariilor profund dezavantajate - Autori: Ioan Iano?;
b) Policentricitatea ?i tratamentul ariilor profund dezavantajate – Autori: Ioan Iano?, Daniel Peptenatu, Loreta Cepoiu, Cristian Draghici, Radu Pintilii;
c) Tipologii ale discontinuita?ilor individualizate la nivelul ariilor profund dezavantajate din România – Autori:Ioan Iano?, Daniela Zamfir, Daniel Peptenatu, Cristian Draghici, Radu Pintilii;
d) Despre complexitatea ariilor profund dezavantajate ?i inser?ia lor în mediile regionale din România – Autori: Ioan Iano?, Cristian Braghina, Cristian Talânga, Daniela Zamfir, Daniel Peptenatu, Valentina Stoica.
|